 Home
Home Archive
 Search
 Sign In
 Site Menu


This Article

Citations
 CrossRef (0)
 - Google Scholar
-
Scopus (0)

Except where otherwise noted, this work is licensed under Creative Commons Attribution-NonCommercial 4.0 International License.
Echocardiographic Assessment of Right Atrium Deformation Indices in Healthy Young Subjects
Abstract
Background: Recently, assessment of the atrial motion and deformation indices obtained via Doppler myocardial imaging (DMI) has been proposed as a new method of exploring the atrial function.
Objective: Our aim was to assess the right atrial (RA) regional function using myocardial velocities, strain, and strain rate imaging (SRI) and compare it with the function of the inter-atrial septum (IAS) and left atrial (LA) lateral wall in healthy young adults.
Patients and Methods: A total of 75 healthy young individuals (35 women and 40 men) underwent standard transthoracic echocardiography and DMI at rest. Myocardial velocities, strain, and SRI profiles from the RA free wall, IAS, and LA lateral wall were calculated throughout the three cardiac cycles. Peak systolic, diastolic and time to peak were derived, and the average of the three cardiac cycles was taken into account for analysis in this study.
Results: The RA peak systolic, peak of early, and late diastolic velocities were 9.2 ± 1.6 cm/s, -9.5 ± 1.8 cm/s, and -8.3 ± 2.1 cm/s, respectively. The RA peak systolic strain was 152% ± 51%. The RA systolic strain was significantly higher than that of the IAS (87% ± 21%, P = 0.001) and the LA lateral wall (89% ± 15%, P = 0.001). The RA peak systolic, peak early and late diastolic SR were 6.3 ± 3.0 s-1, -5.4 ± 1.7 s-1, and -4.5 ± 2.2 s-1, respectively.
Conclusions: DMI proved to be a feasible and reproducible method for the assessment of the RA function in healthy young subjects. Study of myocardial properties showed that the RA free wall myocardial motion and deformation were significantly higher than those of the IAS and the LA lateral wall, but the rate of the RA free wall deformation was not significantly higher than that of the IAS and the LA lateral wall.
Keywords: Right Atrium; Normal Values; Velocity; Strain; Strain Rate
1. Background
The right atrium (RA) is a dynamic structure with complex mechanics. William Harvey was the first to identify the atrium as a receptacle storehouse and reported that the RA was the first to live, and the last to die (1). Ideally, the RA should transfer a high volume of blood to the right ventricle (RV) rapidly at low pressure to prevent from peripheral edema and hepatic congestion (2). Assessment of active and passive atrial functions is an integral part in the examination of the cardiac function and is vital to the diagnosis and treatment of patients with primarily or secondarily affected atrial function (2-4). Recently, the regional assessment of the atrial motion and deformation properties obtained via Doppler-derived velocity and strain/strain rate imaging (SRI) has been proposed as a new method for the exploration of the atrial function (3-6). SRI is calculated from the regional velocity gradients within the sample volume aligned with the Doppler beam. Strain rate (SR) measures the rate of the myocardial deformation, and peak systolic SR and diastolic SR represent the magnitude of the peak deformation rate in systole and diastole. Strain is obtained through integrating SR and represents the deformation of the myocardium over time, and end-systolic strain represents the magnitude of peak deformation in systole (7-9). Motion and deformation are important components of the left ventricular (LV) performance, but study of the atrial function through echocardiography has not yet been fully established. Doppler myocardial imaging (DMI) has been employed as a promising method to quantify the regional myocardial function as a sensitive and reproducible tool in healthy subjects as well as in several diseases involving the atria. But using this method in the assessment of the RA deformational function is not a common practice (8,10, 11). In most of the studies which hitherto carried out the evaluation the left atrial (LA) function,(12-18) there is currently a lack of data on the evaluation of the RA function via SRI (19-21).
2. Objective
In this study, we sought to determine the normal values of the myocardial velocities, strain, and SRI of the RA free wall in healthy young adults and compare them with those of the inter-atrial septum (IAS) and the LA lateral wall.
3. Patients and Methods
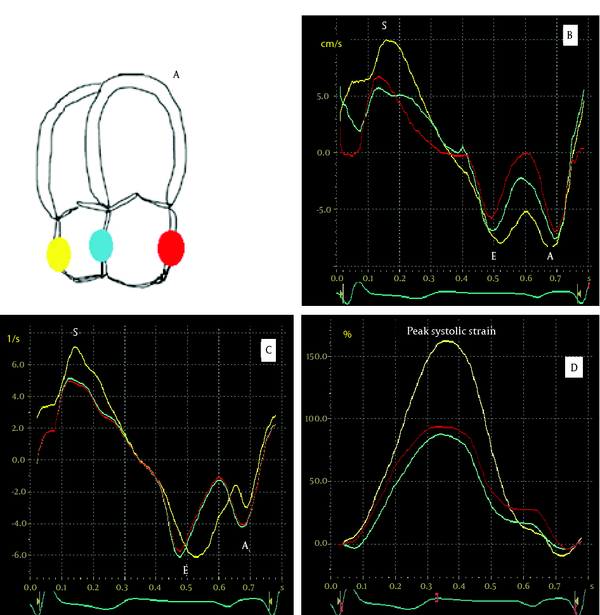
A total of 75 healthy young individuals (age = 15-40 years old, mean age = 29 ± 14 years; 35 women and 40 men) underwent standard transthoracic echocardiography (TTE) at rest. All the patients had unremarkable clinical history and normal findings on physical examination, ECG, and baseline echocardiography, and none of them was taking cardiac medications. The mean of heart rate was 67 ± 14 bpm. The study was approved by the Ethics Committee of Rajaie Cardiovascular Medical and Research Center, and written informed consent was obtained from all the participants prior to their inclusion in the study. Standard TTE study was performed with a GE Vivid seven scanner equipped with an M3S multi-frequency- phased array transducer and tissue Doppler imaging facility. Data were acquired with the subjects at rest, lying in the lateral supine position. Grey-scale images were obtained using second-harmonic imaging (1.7/3.4 MHz). Two-dimensional ECG was superimposed on the images, and end-diastole was considered at the peak R-wave of the ECG. The left ventricular ejection fraction (LVEF) was measured using the Simpson's biplane method by measuring the end-diastolic and end-systolic volumes in 2D images. Measurements of the LV and LA dimensions were made in accordance with the American Society of Echocardiography (ASE) recommendations. The ratio between peak early (E) and late (A) diastolic LV filling velocities and E wave deceleration time was determined using standard Doppler imaging. The timings of the mitral and aortic valve opening and closure were defined using pulsed wave Doppler tracings of the mitral inflow and the LV outflow. Color DMI was performed using standard transthoracic apical four-chamber views according to the guidelines of the ASE, and the raw data were recorded at a depth of 16 cm, frequency of 2.4 MHz, and high frame rates of 140-170 frames/s throughout the three cardiac cycles and stored digitally in cine-loop format on the memory of the scanner. To obtain regional myocardial velocity, strain, and SR, off-line analysis was performed using the quantitative analysis software (EchoPac, General Electric Imaging System). . Because of the thin atrial walls, three digital 2-mm sample volumes were placed within the mid portion of the RA free wall, IAS, and LA lateral walls; and the profiles were acquired over the three cardiac cycles. Peak systolic, early and late diastolic velocities, peak systolic strain, peak systolic, early and late diastolic strain rates were derived (Figure 1, B, C and D) and subsequently averaged to obtain mean values. End-diastole and end-systole were defined to be at the electrocardiographic R peak and at the end of the electrocardiographic T-wave, respectively. Time to peak strain and SR were calculated from the beginning of Q-wave to the peak of systolic strain and early diastolic SR. The echocardiographic analyses were performed by an experienced observer, and all the Doppler data were measured at end-expiration. Intra-observer and inter-observer variabilities were assessed separately for the calculated indices. For the assessment of the intra-observer variability, the analyses were repeated twice by the same observer within two weeks. For the assessment of the inter-observer variability, a second independent observer repeated the analyses. The image was obtained from the apical four-chamber view of the heart (A). The series of velocity and strain rate curves comprised peak systolic [S], peak early and late diastolic [E and A, respectively] components All the continuous variables are expressed as mean ± standard deviation (SD). The normal distribution was tested using the Kolmogorov-Smirnov (K-S) test. The continuous variables were compared with the independent-samples t-test or One-way Analysis of Variance (ANOVA). The Post-Hoc least significant differences (LSD) test was used for multiple comparisons. P-values ≤ 0.05 were considered statistically significant. The reproducibility was obtained for the analysis of the peak systolic velocity, strain and strain rate values from 20 randomly chosen subjects by two independent observers and repeated measurement of these parameters at another occasion. The intra-observer and inter-observer variabilities were the differences between the measurements expressed as an error percentage of the means. All the statistical analyses were performed using the SPSS v. 16 for Windows (SPSS Inc. Chicago, IL, USA).3.1. Study Participants
3.2. Echocardiography
3.3. Doppler Myocardial Imaging and Offline Analysis

3.4. Statistical Analysis
4. Results
The general characteristics of the study population are presented in Table 1.
|
|
Table 1.
General Characteristics of the Study Population
|
4.1. RA Free Wall Systolic and Diastolic Velocities Compared With IAS and LA Lateral Wall Values
The RA peak systolic, peak early and late diastolic velocities were 9.2 ± 1.6 cm/s, -9.5 ± 1.8 cm/s, and -8.3 ± 2.1 cm/s, respectively; there were no significant differences between the absolute value of them (P > 0.05). The RA systolic velocity was significantly higher than that of the IAS (9.2 ± 1.6 cm/s vs. 6.7 ± 2.0 cm/s, P = 0.041) and the LA lateral wall (9.2 ± 1.6 cm/s vs. 7.1 ± 1.2 cm/s, P = 0.048). The RA early diastolic velocity was not significantly higher than that of the IAS (-9.5 ± 1.8 cm/s vs. -8.2 ± 3.0 cm/s, P = 0.084), but it was significantly higher than that of the LA lateral wall (-9.5 ± 1.8 cm/s vs. -4.9 ± 2.1 cm/s, P = 0.044). In addition, the RA late diastolic velocity was not significantly higher than that of the IAS (-8.3 ± 2.1 cm/s vs. -7.1 ± 2.0 cm/s, P = 0.197), but it was significantly higher than the LA lateral wall late diastolic velocity (-8.3 ± 2.1cm/s vs. -6.2 ± 1.6 cm/s, P = 0.039).
4.2. RA Free Wall Systolic Strain and SR Compared With IAS and La Free Wall Values
The RA peak systolic strain was 152% ± 51%. The RA systolic strain was significantly higher than that of the IAS (152% ± 51% vs. 87% ± 21%, P = 0.001) and the LA lateral wall (152% ± 51% vs. 89% ± 15%, P = 0.001). The RA peak systolic, peak early and late diastolic SR were 6.3 ± 3.0 s-1, -5.4 ± 1.7 s-1 and -4.5 ± 2.2 s-1, respectively; there were significant differences between the absolute value of them (P < 0.05). The RA peak systolic SR was significantly higher than RA late diastolic SR (P < 0.05). The RA systolic SR was not significantly higher than the IAS (6.3 ± 3.0 s-1 vs. 4.9 ± 2.3 s-1, P = 0.147) and the LA lateral wall systolic SR (6.3 ± 3.0 s-1 vs. 5.6 ± 3.4 s-1, P = 0.312). Also, the RA early diastolic SR was not significantly higher than the IAS (-5.4 ± 1.7 s-1 vs. -4.8 ± 1.8 s-1, P = 0.223) and the LA lateral wall early diastolic SR (-5.4 ± 1.7 s-1 vs. -4.9 ± 2.1 s-1, P = 0.518). Moreover, the RA late diastolic SR was not significantly higher than the IAS (-4.5 ± 2.2 s-1 vs. -4.1 ± 1.9 s-1 , P = 0.603) and the LA lateral wall SR (-4.5 ± 2.2 s-1 vs. -4.0 ± 1.6 s-1, P = 0.311).
4.3. Time to Peak Systolic Strain and Strain Rate
Time to peak systolic strain and SR were defined by calculating the time to reach peak systolic strain and SR for each of the RA free wall, IAS, and LV lateral wall and correcting the times by the Bazett formula (22) .There were no significant differences between the RA free wall and IAS in terms of time to peak strain; there were, however, significant differences with respect to time to peak strain rate (353 ± 31 ms vs. 371 ± 32 ms, P = 0.056 and 182 ± 33 ms vs. 248 ± 32 ms, P = 0.01 for time to peak strain and time to peak strain rate, respectively). Furthermore, there were significant differences between the RA free wall and the LA lateral wall data (352 ± 30 ms vs. 391 ± 27 ms, P = 0.02 and 182 ± 26 ms vs. 257 ± 32 ms, P = 0.002 for time to peak strain and strain rate, respectively).
4.4. Reproducibility
The intra-observer variability for peak systolic velocities, strain values, and strain rate were 3%, 5%, and 9%, respectively. The inter-observer variability for peak systolic velocities, strain values, and strain rate were 4%, 7%, and 12%, respectively.
5. Discussion
In this study, we assessed the longitudinal velocity, strain and SR values and time to peaks in the RA free wall segment using tissue Doppler and SRI and thereafter compared the data with those measured in the IAS and the LA lateral wall. The RA function plays an important role in maintaining the cardiac function because it serves as a reservoir, conduit, and booster pump to the RV. In the reservoir function, the closure of the tricuspid valve is followed by the storage of blood; and the opening of the valve leads releasing the stored blood. In the conduit function, when the tricuspid valve is open, passive blood is transferred directly from the coronary and systemic veins into the RV. And in the booster pump function, the atrium contracts and ventricular filling completes in late diastole (2). In this study, the three above-mentioned components of the RA function were assessed via Doppler-derived motion and deformation parameters in healthy young adults. It deserves to note that the strain curve evaluated through the Doppler method is very compatible with the RA physiology. During the period of the RA reservoir (which corresponds to the phase of the RV systole), the RA strain increases and thus reaches a peak at the end of the RA filling just before the opening of the tricuspid valve. The RA strain rate can also represent the RA reservoir function, and the measurement of changes in the atrial SR during passive atrial filling could potentially provide an index of atrial compliance. During the reservoir phase, the atrial myocardium stores elastic energy released due to opening of the tricuspid valve to aid early ventricular filling. The velocity of this spring-like function of the myocardium can be demonstrated by the RA strain rate. During the opening of the tricuspid valve and the early rapid filling phase, the RA strain decreases and early diastolic SR appears in the strain rate curve, which reaches a negative peak before atrial contraction (booster phase). During the booster phase, the RA strain rate curve shows the second negative peak at the end of the RA contraction (2, 23). Therefore, measurement of the RA strain and SR may represent a relatively rapid and easy-to-perform method for the assessment of the RA function and may be clinically important in case of a number of pathophysiological conditions associated with an abnormal RA function, e.g. valvular heart diseases, (20) supraventricular arrhythmias, (16) pulmonary hypertension, (19) heart failure, and cardiomyopathies (21). It has been suggested that in healthy subjects, the RA free wall has the highest late diastolic velocity and late diastolic SR compared with the IAS and LA free wall. In the study by Zhang et al. (4) on normal subjects (59 ± 13 years old), the RA, IAS, and LA velocities were compared: the RA late diastolic velocity was significantly higher than the IAS and LA free wall velocities (-9.0 ± 2.6 cm/s at RA vs. -5.6 ± 1.3 cm/s at IAS and -7.5 ± 2.4 cm/s at LA; P < 0.001), and the IAS had the lowest velocity. In another study, Yu et al. (24) assessed the regional atrial function at the LA, RA, and IAS in normal subjects (64 ± 10 years old) and found that late diastolic velocity was significantly higher in the RA than in the LA and IAS (-9.2 ± 2.9 cm/s at RA vs. -5.7 ± 1.5 cm/s at IAS and -7.7 ± 2.6 cm/s at LA; P < 0.001). In our study, peak systolic velocity in healthy young subjects (29 ± 14 years old) was the highest at the RA, followed by the LA, and the lowest was at the IAS. Also, peak early and late diastolic velocities were the highest at the RA, but there were no significant differences between the IAS and LA lateral wall. Therefore, the RA free wall had higher mobility compared to LA and IAS. According to the previous studies, the IAS is placed between the two atria and its movement is thus dependent on the function of both atria and the measurement of its deformational properties may be an average of the right and left sides. In the present study, peak systolic strain was the highest at the RA compared to the IAS and LA. However, systolic SR and diastolic SR were not statistically different among the three walls. The IAS and LA motion and deformation properties were less than those of the right one. It might be explained that in normal conditions, the right side of the heart acts as a very low resistance system and the RA, with higher pectinate muscle masses, has to transfer a high volume of blood rapidly to the RV in order to prevent from peripheral edema and liver congestion. Consequently, it has to work harder than the LA, leads to the higher strain and velocity of the RA myocardium.
5.1. Clinical Implications
The measurements of ventricular myocardial velocities, strain, and SR properties have enhanced the ability to assess the regional myocardial function non-invasively. As a result, TDI and SRI may not only be useful non-invasive tools for the assessment of the atrial function but also they may be helpful in detecting the early signs of atrial dysfunction in the absence of other echocardiographic evidence of atrial pathology (12-14, 16-21). According to the results of the present study and previous studies on the deformational properties of the LA (12, 13, 16-18) and the few studies conducted hitherto on the RA function(19-21), DMI represents the RA reservoir, conduit, and booster pump functions.
5.2. Study Limitations
Doppler-derived velocity, strain, and SR imaging may give large errors if the orientation of the myocardial segments is not aligned with the ultrasound beam (7). In this study, meticulous care was taken to obtain the data by limiting the angle of interrogation in an attempt to align at as low a degree as possible to the longitudinal motion. The reported data are limited to the mid-portion longitudinal atrial function of healthy young adults at rest. Further studies may be necessary to clarify motion and deformation values from infancy to adulthood with more elderly patients and also demonstrate the data in stress tissue Doppler echocardiography. TDI and SRI are simple, feasible, and reproducible methods for the assessment of the RA free wall mechanical function by longitudinal velocity, strain, and SRI in healthy young adults. As a result, the active booster pump function as well as the passive reservoir and conduit functions of the atria can be evaluated, which may confer a better and earlier diagnosis of the related cardiac disease in comparison with the available reference values. In our patients, the RA free wall velocity and especial, systolic strain were significantly higher than those of the IAS and the LA lateral wall, but the RA strain rate was not significantly higher than that of the IAS and the LA lateral wall.
Acknowledgments
We are grateful to personnel of echocardiography department of Rajaie Cardiovascular Medical and Research Center who did favors throughout this project.
Footnotes
References
- 1. Harvey W. An anatomical study of the motion of the heart and of the blood in animals. Baltimore: MD: Thomas; 1928. 123 pp.
- 2. Gaynor SL, Maniar HS, Prasad SM, Steendijk P, Moon MR. Reservoir and conduit function of right atrium: impact on right ventricular filling and cardiac output. Am J Physiol Heart Circ Physiol. 2005;288(5):H2140-5. [DOI] [PubMed]
- 3. Quintana M, Lindell P, Saha SK, del Furia F, Lind B, Govind S, et al. Assessment of atrial regional and global electromechanical function by tissue velocity echocardiography: a feasibility study on healthy individuals. Cardiovasc Ultrasound. 2005;3:4. [DOI] [PubMed]
- 4. Zhang Q, Kum LC, Lee PW, Lam YY, Wu EB, Lin H, et al. Effect of age and heart rate on atrial mechanical function assessed by Doppler tissue imaging in healthy individuals. J Am Soc Echocardiogr. 2006;19(4):422-8. [DOI] [PubMed]
- 5. Baltabaeva A, Marciniak M, Bijnens B, Parsai C, Moggridge J, Antonios TF, et al. How to detect early left atrial remodelling and dysfunction in mild-to-moderate hypertension. J Hypertens. 2009;27(10):2086-93. [DOI] [PubMed]
- 6. Kalinin AO, Alekhin MN, Bakhs G, Shipachov PN. [Atrial myocardial deformation in healthy individuals of two-dimensional strain]. Kardiologiia. 2010;50(2):62-8. [PubMed]
- 7. Marwick TH. Measurement of strain and strain rate by echocardiography: ready for prime time? J Am Coll Cardiol. 2006;47(7):1313-27. [DOI] [PubMed]
- 8. Sutherland GR, Di Salvo G, Claus P, D'Hooge J, Bijnens B. Strain and strain rate imaging: a new clinical approach to quantifying regional myocardial function. J Am Soc Echocardiogr. 2004;17(7):788-802. [DOI] [PubMed]
- 9. Urheim S, Edvardsen T, Torp H, Angelsen B, Smiseth OA. Myocardial strain by Doppler echocardiography. Validation of a new method to quantify regional myocardial function. Circulation. 2000;102(10):1158-64. [PubMed]
- 10. Spencer KT, Mor-Avi V, Gorcsan J, 3rd, DeMaria AN, Kimball TR, Monaghan MJ, et al. Effects of aging on left atrial reservoir, conduit, and booster pump function: a multi-institution acoustic quantification study. Heart. 2001;85(3):272-7. [PubMed]
- 11. Thomas L, Levett K, Boyd A, Leung DY, Schiller NB, Ross DL. Changes in regional left atrial function with aging: evaluation by Doppler tissue imaging. Eur J Echocardiogr. 2003;4(2):92-100. [PubMed]
- 12. Cho GY, Jo SH, Kim MK, Kim HS, Park WJ, Choi YJ, et al. Left atrial dyssynchrony assessed by strain imaging in predicting future development of atrial fibrillation in patients with heart failure. Int J Cardiol. 2009;134(3):336-41. [DOI] [PubMed]
- 13. Di Salvo G, Caso P, Lo Piccolo R, Fusco A, Martiniello AR, Russo MG, et al. Atrial myocardial deformation properties predict maintenance of sinus rhythm after external cardioversion of recent-onset lone atrial fibrillation: a color Doppler myocardial imaging and transthoracic and transesophageal echocardiographic study. Circulation. 2005;112(3):387-95. [DOI] [PubMed]
- 14. Inaba Y, Yuda S, Kobayashi N, Hashimoto A, Uno K, Nakata T, et al. Strain rate imaging for noninvasive functional quantification of the left atrium: comparative studies in controls and patients with atrial fibrillation. J Am Soc Echocardiogr. 2005;18(7):729-36. [DOI] [PubMed]
- 15. Tabata T, Oki T, Yamada H, Iuchi A, Ito S, Hori T, et al. Role of left atrial appendage in left atrial reservoir function as evaluated by left atrial appendage clamping during cardiac surgery. Am J Cardiol. 1998;81(3):327-32. [PubMed]
- 16. Tops LF, Delgado V, Bertini M, Marsan NA, Den Uijl DW, Trines SA, et al. Left atrial strain predicts reverse remodeling after catheter ablation for atrial fibrillation. J Am Coll Cardiol. 2011;57(3):324-31. [DOI] [PubMed]
- 17. Tsai WC, Lee CH, Lin CC, Liu YW, Huang YY, Li WT, et al. Association of left atrial strain and strain rate assessed by speckle tracking echocardiography with paroxysmal atrial fibrillation. Echocardiography. 2009;26(10):1188-94. [DOI] [PubMed]
- 18. Wang T, Wang M, Fung JW, Yip GW, Zhang Y, Ho PP, et al. Atrial strain rate echocardiography can predict success or failure of cardioversion for atrial fibrillation: a combined transthoracic tissue Doppler and transoesophageal imaging study. Int J Cardiol. 2007;114(2):202-9. [DOI] [PubMed]
- 19. Wang T, Wang M, Fung JW, Yip GW, Zhang Y, Ho PP, et al. Atrial strain rate echocardiography can predict success or failure of cardioversion for atrial fibrillation: a combined transthoracic tissue Doppler and transoesophageal imaging study. Int J Cardiol. 2007;114(2):202-9. [DOI] [PubMed]
- 20. Asad N, Johnson VM, Spodick DH. Acute right atrial strain: regression in normal as well as abnormal P-wave amplitudes with treatment of obstructive pulmonary disease. Chest. 2003;124(2):560-4. [PubMed]
- 21. Caso P, Ancona R, Di Salvo G, Comenale Pinto S, Macrino M, Di Palma V, et al. Atrial reservoir function by strain rate imaging in asymptomatic mitral stenosis: prognostic value at 3 year follow-up. Eur J Echocardiogr. 2009;10(6):753-9. [DOI] [PubMed]
- 22. Ojaghi Haghighi Z, Naderi N, Amin A, Taghavi S, Sadeghi M, Moladoust H, et al. Quantitative assessment of right atrial function by strain and strain rate imaging in patients with heart failure. Acta Cardiol. 2011;66(6):737-42. [PubMed]
- 23. Bazett HC. An analysis of time relations of electrocardiograms. Heart . 1920;7(353-70)
- 24. Grant C, Bunnell IL, Greene DG. The Reservoir Function of the Left Atrium during Ventricular Systole. An Angiocardiographic Study of Atrial Stroke Volume and Work. Am J Med. 1964;37:36-43. [PubMed]
")


