 Home
Home Archive
 Search
 Sign In
 Site Menu


This Article

Citations
 CrossRef (0)
 - Google Scholar
-
Scopus (0)

Except where otherwise noted, this work is licensed under Creative Commons Attribution-NonCommercial 4.0 International License.
Ventricular Dyssynchrony Markers in Healthy Black African Subjects: A Tissue Doppler Imaging Study
Abstract
Background: Tissue Doppler is a promising method that allows the measurement of time of systolic and diastolic tissue velocities. Ventricular dyssynchrony was assessed in patients with heart failure. In sub-Saharan Africa, very few studies have focused on ventricular dyssynchrony in healthy subjects.
Objectives: The purpose of this study was to measure time-to-peak of systolic and diastolic velocities of different segments of left ventricle and apply ventricular dyssynchrony markers to healthy black African subjects.
Patients and Methods: Fifty healthy black African were enrolled consecutively over a period of 3 months. Time-to-peak systolic velocities (TS) and Time-to-peak early diastolic velocities (TE) were measured at the four basal segments of left ventricle. Five dyssynchrony markers were assessed: difference between maximal time-to-peak systolic velocity and minimal time-to-peak systolic velocity, time between septal time-to-peak systolic velocity and lateral time-to peak systolic velocity, standard deviation of time-to-peak systolic velocity of the four basal segments, difference between maximal time-to-peak early diastolic velocity and minimal time-to-peak early diastolic velocity, and standard deviation of time-to-peak early diastolic velocity of the four basal segments.
Results: The frequency of some dyssynchrony markers was similar to that of other studies. The difference between maximal time-to-peak systolic velocity and minimal time-to-peak systolic velocity was correlated with age and was higher among women. The prevalence of diastolic dyssynchrony was higher in black African subjects.
Conclusions: Large-scale studies on the healthy black African population could assess the relationship between diastolic dyssynchrony and changes in myocardial performance related to racial differences.
Keywords: Ventricular Dyssynchrony; Tissue Doppler Imaging; Healthy Subjects
1. Background
Ventricular dyssynchrony appears to be an important concept in patients with heart failure (1, 2). Tissue Doppler is a promising method that allows the measurement of time of systolic and diastolic velocities. Several systolic and diastolic mechanical dyssynchrony markers were used: between left ventricle and right ventricle (interventricular dyssynchrony) or between the walls of left ventricle (intraventricular dyssynchrony) (3-6). Cardiac resynchronization therapy (CRT) is widely practiced in the treatment of patients with chronic heart failure with ventricular conduction abnormalities (7, 8). However, 30% of these patients remain non-responders despite a selection based on effective criteria (9, 10). A better understanding of the synchronization of contraction and relaxation on the physiological scale is required (11). Reference values are absolutely necessary (5).
2. Objectives
In sub-Saharan Africa, few studies have focused on ventricular dyssynchrony in healthy subjects. The purpose of this study was to measure time-to-peak systolic and diastolic velocities of different left ventricle segments and apply dyssynchrony markers to a healthy black African population.
3. Patients and Methods
Fifty healthy black African volunteers were enrolled between January and March 2014. They had no cardiovascular risk factor or chronic or acute diseases. Their physical and electrocardiographic examinations were strictly normal. Subjects with hypertension, diabetes, a medical condition, a medical long-term treatment were excluded. Inclusion was performed after verbal informed consent of patients.
Echocardiographic examination was performed using a “General Electric VIVID 7 PRO” ultrasound device put in service in 2006. A probe of 3.5 MHz was used and patients were installed in left lateral decubitus position. Standard two-dimensional echocardiography mode, time-motion and Doppler were performed. The measurements were performed according to the recommendations of the American Society of Echocardiography (12). Systolic ejection fraction of left ventricle was calculated using the biplane Simpson method.
3.1. Doppler Examination
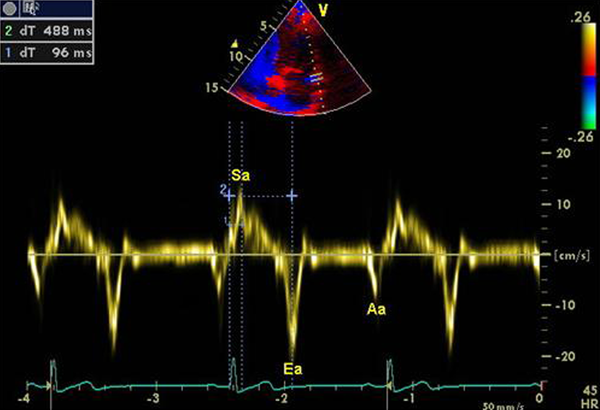
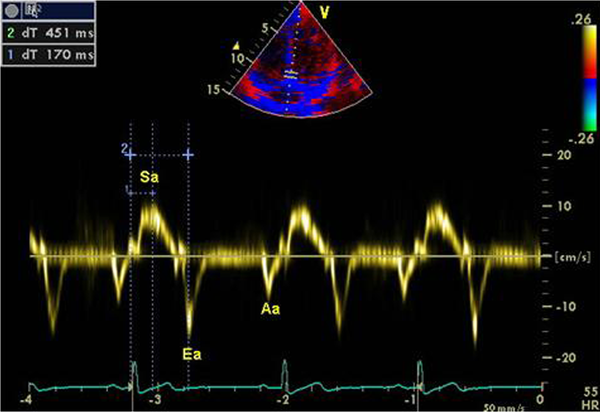
Diastolic left ventricular function was assessed by transmitral flow (E wave peak, A wave peak, deceleration time of E wave). The activation of the tissue Doppler function allowed to assess the longitudinal tissue velocities at the level of the basal segments. A model of assessment of basal segments of the 4 walls was used to assess the regional systolic function of left ventricle in apical four- chamber and two-chamber Views. The studied walls were: lateral, anterior, septal and inferior. Three velocities were recorded: positive systolic Sa wave, protodiastolic Ea wave and telediastolic Aa wave. Figures 1 and 2 show the time of systolic velocity and the time of diastolic velocities of the mitral annulus in tissue Doppler imaging for anterior and septal segments. At least four cardiac cycles were recorded for each section.

|
Figure 1.
Intervals Measurements in Anterior Basal Segment
|

|
Figure 2.
Intervals Measurements in Septal Basal Segment
|
The diastolic left ventricular function was also assessed by the E/Ea ratio as recommended by the American Society of Echocardiography (12). Ea wave peak of the lateral segment was chosen for E/Ea ratio (12). Subjects who had diastolic dysfunction with abnormal E/A or E/Ea ratio (13), heart rate more than 100 bpm (beats per minute) or less than 50 bpm were excluded. Time-to-peak systolic velocity (from the onset of QRS complex to the peak of Sa wave) and time-to-peak diastolic velocity (from the onset of QRS complex to the peak of Ea wave) were measured for each segment. When Sa wave had several peaks, the measurement took into account the first peak (5, 13). All Doppler measurements were taken at least 3 times and the result used was the average of the measurements.
The following markers of dyssynchrony were calculated. Threshold values are shown in parentheses: 1. TS max: Difference between maximal and minimal time-to-peak systolic velocity (40 ms) (14). 2. TS sep-lat: Difference between time-to-peak systolic velocity of the septal wall and time-to- peak systolic velocity of the lateral wall (65 ms) (15). 3. TS SD: standard deviation of time-to- peak systolic velocity of all walls (33 ms) (16). 4. TE max: Difference between maximal and minimal time-to-peak diastolic velocity (40 ms) (3). 5. TE SD: standard deviation of time-to-peak early diastolic velocity of all walls (25 ms) (17)
3.2. Statistical Analysis
Data were analyzed using EPI INFO software version 3.5.1. Categorical variables were expressed as number followed by percentage. Quantitative variables were expressed as Mean ± Standard Deviation or median (interquartile range). Student test was used for comparison of means. Pearson correlation coefficients were calculated by linear regression. P < 0.05 was considered significant.
4. Results
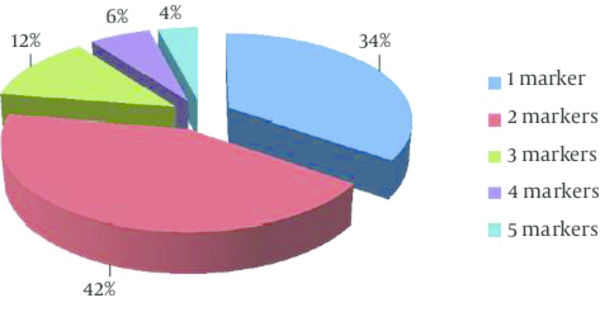
Fifty subjects were studied. The average age was 35.3 ± 9.1 years with extremes of 24 and 54. Half of the sample was male. There were no significant differences between males and females for epidemiological, clinical, electrocardiographic and echocardiographic conventional data (Table 1). The ethics committee approved the study and all volunteers signed informed consent forms. Table 2 shows the comparison of markers of left intraventricular systolic dyssynchrony according to gender. Sixty percent of patients had a TS max above the threshold value. For TS sep-lat and TS SD, the prevalence of systolic dyssynchrony was respectively 14 and 94% (Table 3). TS max was strongly correlated with age. However, there was no correlation between age and the other systolic dyssynchrony markers: TS sep-lat and TS SD (Table 4). Data of left intraventricular diastolic dyssynchrony markers and their comparisons according to gender are shown in Table 2. The overall prevalence of diastolic dyssynchrony (according to threshold values) was 18% for TE max and 8% for the TE SD (Table 3). There was a mean correlation between the TE max and age. There was a small but significant increase in TE SD with age (Table 4). Figure 3 showing distribution of healthy subjects according to the number of dyssynchrony markers. All subjects had at least one dyssynchrony marker. Table 2 shows the comparison between male and female according to the median of dyssynchrony markers number. Dyssynchrony markers frequencies according to the sex are indicated in Table 3.4.1. Conventional Characteristics
![]()
4.2. Left Intraventricular Systolic Dyssynchrony
![]()
![]()
![]()
4.3. Left intraventricular Diastolic Dyssynchrony

5. Discussion
Several studies have used tissue Doppler to study left intraventricular dyssynchrony in healthy subjects in order to determine normal ranges of reference. African studies on ventricular dyssynchrony are very poorly documented. To our knowledge, this is the first study that assessed systolic and diastolic left intraventricular dyssynchrony markers in a healthy black African population. The median value of TS max was 52 (25, 66) ms. An Iranian study shows a prevalence of 69.2% on the basis of this marker (5). Despite the differences in threshold value (78 ms for Sadeghian et al. (5) and 40 ms in this study) and evaluation model (12 segments for Sadeghian et al. (5) and 4 segments in this study), the prevalence of dyssynchrony according to the TS max was similar. For Kwon et al. (4), the average value of TS max was 72 ms with an evaluation model of 12 segments and a threshold value of 100 ms. However, the chosen peak when Sa wave showed several peaks was not specified. Lafitte et al. (18) found a mean value of 21 ± 12 ms for the TS max.
With TS sep-lat marker, 14% of subjects had Dyssynchrony. This result was consistent with that of Kwon et al. (4). Sadeghian et al. (5) and Miyazaki et al. (19) found higher prevalence: 41.5% and 50%. However, Lafitte et al. (18) have reported an average of 17 ± 9 ms for the TS sep-lat in normal subjects. TS SD median was 45 (40, 54) ms and the prevalence of dyssynchrony according to this marker was higher than that of other studies. Sadeghian et al. (5) showed a prevalence of 66.2% on TS SD basis. Variability in the prevalence of systolic dyssynchrony index could be linked to individual and spontaneous differences of excitation-contraction coupling process rather than a pathological situation. In addition, the high temporal resolution of Doppler techniques may reveal minor regional differences having no physiological and clinical significance (20).
Prolonged time-to-peak systolic velocities associated with variability of the excitation-contraction coupling process could explain the high prevalence of systolic dyssynchrony in healthy black Africans. Despite this variability, the correlation between TS max and age was high. Poerner et al. (21) found similar results and recommended consideration of this finding in clinical practice. Concerning TS SD and TS sep-lat, no correlation with age was found. The results of Ng et al. (6) are similar. Women had a higher TS max. Sadeghian et al. (5) showed that the TS SD and TS sep-lat were higher among women.
In our black African population, significant variations according to age and gender were observed for TS max. Diastolic dyssynchrony was assessed with two markers: TE max and TE SD. TE max median was 22 (15, 33) ms. The prevalence of diastolic dyssynchrony based on this marker was 18%. It was higher than that of Schuster et al. (3). TE SD median was 9 (7, 15) ms, in agreement with the results of several studies (3, 4, 6, 22). However, the prevalence of dyssynchrony according to this marker was higher in our study. The diastolic dyssynchrony appears to be more common in our population. It has been proven that the relative parietal thickness was greater in healthy black subjects. It is not accompanied by significant changes in conventional Doppler parameters of the diastolic function of the left ventricle (23). This increase in relative parietal thickness observed in black Africans could be deleterious. Koren et al. (24) demonstrated that the relative increase in parietal thickness predisposed to high risk of cardiovascular events, although ventricular mass was normal. Kwon et al. (4) showed that hypertensive patients with significant relative parietal thickness had more diastolic dyssynchrony. Studies should be conducted to understand the relationship between relative parietal thickness and diastolic dyssynchrony in healthy subjects. TE max and TE SD were correlated with age. Ng et al. (6) found similar results. The alteration of the cardiovascular system by the progression of atherosclerosis related to age is believed to cause an increase in the afterload, ventricular hypertrophy and a degradation of the function of relaxation of left ventricle (25, 26).
There was no significant gender difference with regard to diastolic dyssynchrony markers in concordance with the results of Ng et al. (6). All subjects had at least one dyssynchrony marker. Forty-two percent (42%) of subjects had two dyssynchrony markers. These results are very similar to those of Sadeghian et al. (5) who showed in his series that 67% of healthy subjects had at least two dyssynchrony markers. Women had more dyssynchrony markers than men (P = 0.01). Sadeghian et al. series (5) showed that 83.9% of women had at least two ventricular dyssynchrony markers. Overall, in black and white healthy subjects, women appear to have more ventricular dyssynchrony than men.
The first limitation of the study was the small sample size and lack of inclusion of older subjects. Indeed, it was difficult to identify elderly subjects without factors of cardiovascular risk. Subjects were considered healthy on the basis of the examination, clinical, electrocardiographic and echocardiographic examination. Coronary angiography and laboratory tests have not been performed because of insufficient technical platform.
This study shows significant prevalence of left systolic and diastolic intraventricular dyssynchrony in healthy black Africans. Large-scale studies on the healthy black African population could assess the relationship between diastolic dyssynchrony and changes in myocardial performance related to racial differences.
Footnotes
References
- 1. Yu CM, Lin H, Zhang Q, Sanderson JE. High prevalence of left ventricular systolic and diastolic asynchrony in patients with congestive heart failure and normal QRS duration. Heart. 2003;89(1):54-60. [PubMed]
- 2. Yu CM, Chau E, Sanderson JE. Tissue Doppler Echocardiographic Evidence of Reverse Remodeling and Improved Synchronicity by Simultaneously Delaying Regional Contraction After Biventricular Pacing Therapy in Heart Failure. Circulation. 2002;105(4):438-45. [DOI]
- 3. Schuster I, Habib G, Jego C, Thuny F, Avierinos JF, Derumeaux G, et al. Diastolic asynchrony is more frequent than systolic asynchrony in dilated cardiomyopathy and is less improved by cardiac resynchronization therapy. J Am Coll Cardiol. 2005;46(12):2250-7. [DOI] [PubMed]
- 4. Kwon BJ, Choi KY, Kim DB, Jang SW, Cho EJ, Youn HJ, et al. Systolic synchrony is impaired in nonleft ventricular hypertrophy of never-treated hypertensive patients. J Hypertens. 2011;29(11):2246-54. [DOI] [PubMed]
- 5. Sadeghian H, Ahmadi F, Lotfi-Tokaldany M, Kazemisaeid A, Fathollahi MS, Goodarzynejad H. Ventricular asynchrony of time-to-peak systolic velocity in structurally normal heart by tissue Doppler imaging. Echocardiography. 2010;27(7):823-30. [DOI] [PubMed]
- 6. Ng AC, Tran da T, Newman M, Allman C, Vidaic J, Lo ST, et al. Left ventricular longitudinal and radial synchrony and their determinants in healthy subjects. J Am Soc Echocardiogr. 2008;21(9):1042-8. [DOI] [PubMed]
- 7. De Marco T, Wolfel E, Feldman AM, Lowes B, Higginbotham MB, Ghali JK, et al. Impact of cardiac resynchronization therapy on exercise performance, functional capacity, and quality of life in systolic heart failure with QRS prolongation: COMPANION trial sub-study. J Card Fail. 2008;14(1):9-18. [DOI] [PubMed]
- 8. Richardson M, Freemantle N, Calvert MJ, Cleland JG, Tavazzi L, Care-Hf Study Steering Committee , et al. Predictors and treatment response with cardiac resynchronization therapy in patients with heart failure characterized by dyssynchrony: a pre-defined analysis from the CARE-HF trial. Eur Heart J. 2007;28(15):1827-34. [DOI] [PubMed]
- 9. Cazeau S, Leclercq C, Lavergne T, Walker S, Varma C, Linde C, et al. Effects of multisite biventricular pacing in patients with heart failure and intraventricular conduction delay. N Engl J Med. 2001;344(12):873-80. [DOI] [PubMed]
- 10. Abraham WT, Fisher WG, Smith AL, Delurgio DB, Leon AR, Loh E, et al. Cardiac resynchronization in chronic heart failure. N Engl J Med. 2002;346(24):1845-53. [DOI] [PubMed]
- 11. Quan X, Zhu TG, Guo S, Ma JX, Wang X, Guo JH. Ventricular synchronicity: observations comparing pulse flow and tissue Doppler assessment in a Chinese healthy adult cohort. Chin Med J (Engl). 2012;125(1):27-32. [PubMed]
- 12. Schiller NB, Shah PM, Crawford M, DeMaria A, Devereux R, Feigenbaum H, et al. Recommendations for quantitation of the left ventricle by two-dimensional echocardiography. American Society of Echocardiography Committee on Standards, Subcommittee on Quantitation of Two-Dimensional Echocardiograms. J Am Soc Echocardiogr. 1989;2(5):358-67. [PubMed]
- 13. Yu. CM, Zhang Q, Fung JWH. Newer echocardiographic techniques for the assessment of cardiac resynchronization therapy. In: Yu CM, Hayes DL, Auricchio A, Malden MA, editor(s). Cardiac Resynchronization Therapy. Victoria: John Wiley & Sons; 2006. 89–137 pp.
- 14. Lafitte S, Serri K, Reant P, Lafitte M, Reuter S, Garrigue S, et al. [Echocardiography and biventricular resynchronisation]. Arch Mal Coeur Vaiss. 2005;98 Spec No 3:41-7. [PubMed]
- 15. Yu CM, Zhang Q, Fung JW, Chan HC, Chan YS, Yip GW, et al. A novel tool to assess systolic asynchrony and identify responders of cardiac resynchronization therapy by tissue synchronization imaging. J Am Coll Cardiol. 2005;45(5):677-84. [DOI] [PubMed]
- 16. Gorcsan J3, Abraham T, Agler DA, Bax JJ, Derumeaux G, Grimm RA, et al. Echocardiography for cardiac resynchronization therapy: recommendations for performance and reporting--a report from the American Society of Echocardiography Dyssynchrony Writing Group endorsed by the Heart Rhythm Society. J Am Soc Echocardiogr. 2008;21(3):191-213. [DOI] [PubMed]
- 17. Chang SA, Kim HK, Kim DH, Kim YJ, Sohn DW, Oh BH, et al. Left ventricular systolic and diastolic dyssynchrony in asymptomatic hypertensive patients. J Am Soc Echocardiogr. 2009;22(4):337-42. [DOI] [PubMed]
- 18. Lafitte S, Bordachar P, Lafitte M, Garrigue S, Reuter S, Reant P, et al. Dynamic ventricular dyssynchrony: an exercise-echocardiography study. J Am Coll Cardiol. 2006;47(11):2253-9. [DOI] [PubMed]
- 19. Miyazaki C, Powell BD, Bruce CJ, Espinosa RE, Redfield MM, Miller FA, et al. Comparison of echocardiographic dyssynchrony assessment by tissue velocity and strain imaging in subjects with or without systolic dysfunction and with or without left bundle-branch block. Circulation. 2008;117(20):2617-25. [DOI] [PubMed]
- 20. Conca C, Faletra FF, Miyazaki C, Oh J, Mantovani A, Klersy C, et al. Echocardiographic parameters of mechanical synchrony in healthy individuals. Am J Cardiol. 2009;103(1):136-42. [DOI] [PubMed]
- 21. Poerner TC, Goebel B, Geiger T, Haghi D, Borggrefe M, Haase KK. Physiological range of mechanical synchronicity of the human heart: comparison between different echocardiographic assessment modalities. Ultrasound Med Biol. 2005;31(9):1163-72. [DOI] [PubMed]
- 22. Lee PW, Zhang Q, Yip GW, Wu L, Lam YY, Wu EB, et al. Left ventricular systolic and diastolic dyssynchrony in coronary artery disease with preserved ejection fraction. Clin Sci (Lond). 2009;116(6):521-9. [DOI] [PubMed]
- 23. Keser N, Yildiz S, Kurtog N, Dindar I. Modified TEI index: a promising parameter in essential hypertension? Echocardiography. 2005;22(4):296-304. [DOI] [PubMed]
- 24. Koren MJ, Devereux RB, Casale PN, Savage DD, Laragh JH. Relation of left ventricular mass and geometry to morbidity and mortality in uncomplicated essential hypertension. Ann Intern Med. 1991;114(5):345-52. [PubMed]
- 25. Cheitlin MD. Cardiovascular physiology-changes with aging. Am J Geriatr Cardiol. 2003;12(1):9-13. [PubMed]
- 26. Kitzman DW. Diastolic dysfunction in the elderly. Genesis and diagnostic and therapeutic implications. Cardiol Clin. 2000;18(3):597-617. x [PubMed]
")


