 Home
Home Archive
 Search
 Sign In
 Site Menu


This Article

Citations
 Google Scholar

Except where otherwise noted, this work is licensed under Creative Commons Attribution-NonCommercial 4.0 International License.
Relation Between Parameters of Myocardial Mechanics and Ventricular Arterial Coupling: A Three-Dimensional Speckle-Tracking Study in Healthy Adults
Abstract
Background: Understanding the relation between ventricular-arterial coupling (VAC) and myocardial mechanical parameters could offer an adjunctive perspective on left ventricular function.
Objectives: Our aim was to study the relation between VAC and the parameters of myocardial mechanics using three-dimensional speckle-tracking echocardiography (3DSTE).
Patients and Methods: We studied 68 normal participants (mean age, 35 ± 12.2 y; 36 [53%] males). VAC was measured by the ratio of arterial elastance (Ea) to ventricular elastance (Ees). The peak systolic value of longitudinal strain (LS), circumferential strain (CS), radial strain, three-dimensional global strain (3DGS), apical rotation, torsion, and twist and their time to peak were calculated.
Results: Almost all deformation indices were higher in the women than in the men. LS (r = -0.41, P < 0.01), twist (r = 0.26, P < 0.03), rotation (r = 0.41, P < 0.01), and 3DGS (r = - 0.39, P < 0.01) were associated with age. Although significant associations were found between VAC and Ea or Ees in the men and women, no relation was found between Ea and Ees in both sexes (r = 0.07 in men and r = 0.08 in women). Indeed, VAC had a stronger association with Ea than with Ees (r = 0.708 vs. r = -0.537). Ees and VAC were related to torsion (r = 0.30 vs. r = -0.37; both P < 0.05); and Ea, Ees, and VAC were also associated with CS (r = 0.64, r = -0.45, and r = 0.79; all P < 0.05) and 3DGS (r = -0.55, r = 0.38, and r = -0.64; all P < 0.01).
Conclusions: Amongst all myocardial mechanical parameters, VAC was related to CS and 3DGS as well as torsion.
Keywords: Ventricular-Arterial Coupling; Myocardial Mechanical Parameters; Three-Dimensional Speckle-Tracking Echocardiography
1. Background
Ventricular-arterial coupling (VAC) indicates the interaction between the ventricle as a pump and the vascular system as a load (1) The components that characterize VAC are arterial elastance (Ea) and left ventricular elastance (Ees) (2) VAC, which was first proposed by Suga (3), is defined as the ratio of Ea to Ees. Ea is a good reflector of the arterial load (4) and is the change in volume for a given change in pressure and can be approximated by the ratio of end-systolic pressure (ESP) to stroke volume (2) ESP can be approximated as 0.9 × brachial systolic blood pressure by a noninvasive estimate of ESP to predict pressure-volume loop measurements of ESP, (5) whereas stroke volume can be estimated as the difference between end-diastolic volume and end-systolic volume (ESV) by echocardiography. Left ventricular (LV) contractility can also be estimated by Ees (6). This index can be calculated as ESP/ESV. The analysis of Ees further helps understand LV contractility, function, and geometry (2). Baseline Ees in healthy subjects is around 2.2 ± 0.8 mmHg/mL (2). For a more reliable evaluation, both Ea and Ees should be indexed for body surface area. In healthy individuals at resting condition, VAC is maintained within a narrow range in order to allow the cardiovascular system to work with its best mechanical efficacy at the lowest energy consumption. Remaining around 1 ± 0.36 ensures mechanical efficacy and energetic sufficiency (2, 7). The main advantage of Ea/Ees is that it can quantify LV contractility and arterial load in the same units by a relatively simple method. It also assists in understanding the effect of abnormalities in Ea and Ees on stroke volume and left ventricular ejection fraction (LVEF). Examining the components of Ea/Ees helps evaluate whether alterations in Ea/Ees are due to changes in LV properties, arterial properties, or both - which LVEF alone is incapable of showing (8). Speckle-tracking echocardiography (STE) has been recently introduced as a novel technique for the evaluation of myocardial deformation and the accurate prediction of LV contractility in cardiovascular diseases. In several studies, a good correlation has been shown between longitudinal strain (LS) and LVEF (9). LS provides a quantitative assessment of myocardial deformation to allow the early detection of systolic dysfunction in patients with preserved LVEF (10). Longitudinal myocardial fibers are known to be the first to be affected in many cardiac conditions (11, 12). Moreover, long-axis function is considered an important component of LV performance, despite its preserved circumferential motion and LVEF. In addition, LV torsion, which measures the rotational deformation of the myocardium, plays an important role in LV contraction (13) and filling (14). The response of LV torsion to acute changes in load was reported by Park et al. (15). However, the contribution of VAC and its components (i.e., Ea and Ees) to LV myocardial deformation indices remains unclear.
2. Objectives
The aim of this study was to evaluate the relationship between the parameters of myocardial mechanics and VAC in normal adult subjects (< 50 y) and to compare these relations with age and sex using three-dimensional (3D) STE.
3. Patients and Methods
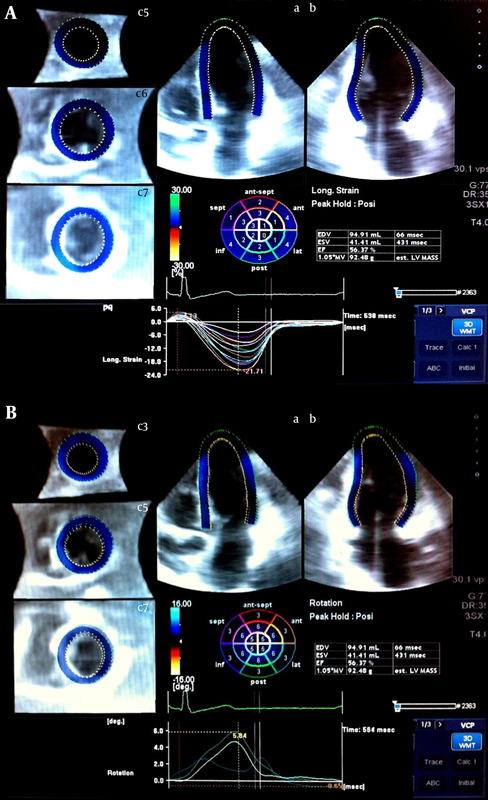
The study population consisted of 68 subjects (mean age, 35 ± 12 y; 53% males) who underwent echocardiographic examinations in our laboratory. Clinical variables - including age, gender, height, weight, and body surface area - were recorded from medical records. The study subjects had no history of cardiovascular disease and showed normal two-dimensional and Doppler echocardiograms. Brachial blood pressure was measured just before the echocardiographic examination and was used for calculating ESP. The study protocol was approved by the Institutional Review Board at Tufts Medical Center. The patients were imaged with a commercially available system (Artida, Toshiba Medical Systems, Tokyo, Japan). Next, 3D echocardiographic data sets were acquired using a 3D transthoracic probe (PST-25SX 1 - 4 MHz phased-array matrix transducer). Full-volume apical data sets were recorded within one breath hold during 3 cardiac cycles. The mean frame rate was 20 volumes/second. Then the 3D data sets were stored in a raw data format for off-line analysis and exported to the UltraExtend Workstation using a semiautomated contour-tracing algorithm (16, 17) Each 3D data set was displayed in a five-plane view: 1 apical four-chamber view (plane A), a second apical view (plane B) orthogonal to plane A (two-chamber view), and 3 short-axis planes in the apical, mid-ventricle, and basal portions of the LV. In plane A (four-chamber), 3 reference points were set: 2 at the base of the LV at the mitral valve level and 1 at the apex. The same 3 points were fixed on plane B. The epicardial border was traced manually (or by setting a default thickness for the myocardium). After the detection of the myocardial borders at the end-diastolic reference frame, LV shape was corrected at the starting image. A robust calculation of LV volumes and LVEF was obtained by performing 3D wall motion tracking through the entire cardiac cycle automatically. The quality of the tracking was then assessed, and if the border detection was not correct or if 3 or more segments were not adequately visualized, the acquisition was discarded from the study. The same process was applied for LS (Figure 1A, upper panel), circumferential strain (CS), radial strain (RS), three-dimensional global strain (3DGS), apical rotation (Figure 1B, lower panel), torsion, and twist measurements for each segment. The data were presented as mean ± standard deviation (SD) for the interval and count (percent) for the categorical variables. One-sample Kolmogorov-Smirnov test was applied to show the fitness of the interval variables to the Gaussian distribution. The Student t test was used to compare the data between the men and women. The relationships between deformation and elastance indices were investigated using the Pearson correlation coefficient (r) and linear regression models. A P value < 0.05 was considered significant. IBM SPSS Statistics® 19 for Windows® (IBM Corp., Armonk, NY) was applied for the statistical analysis.3.1. Study Population and Protocol
3.2. Three-Dimensional Echocardiography with Speckle-Tracking Echocardiography

3.3. Statistical Analysis
4. Results
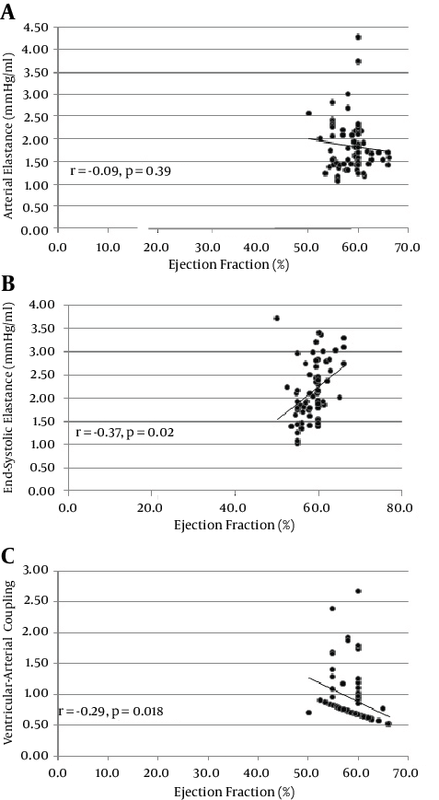
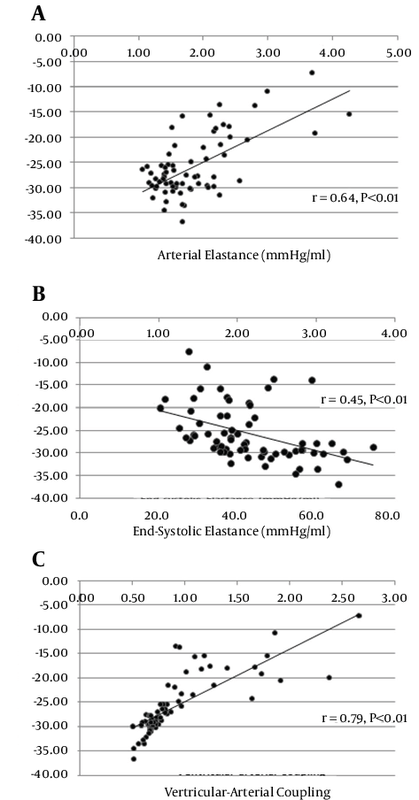
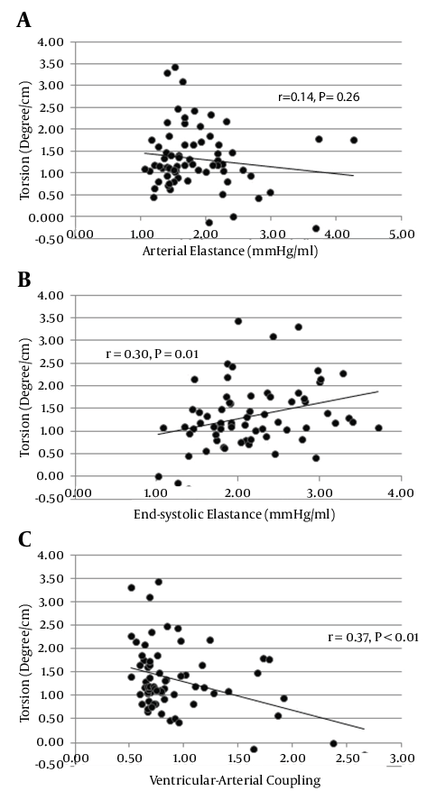
Table 1 lists the baseline characteristics of the study population. There were no significant differences in age (33 ± 10.4 and 36 ± 13.9; P = 0.210) and LVEF (58.1 ± 2.9 and 59.4 ± 3.5; P = 0.088) between the men and women. The mean of LVEF, Ea, Ees, and VAC was 58.8 ± 3.2%, 1.85 ± 0.62 mmHg/mL, 2.16 ± 0.61 mmHg/mL, and 0.92 ± 0.44 - respectively. Peak systolic deformation indices were measured for each segment as a percentage of cardiac cycle (Table 2). There was a significant relationship between age and LS (r = -0.41, P < 0.01), twist (r = 0.26, P < 0.03), rotation (r = 0.41, P < 0.01), and 3DGS (r = -0.39, P < 0.01) (Table 2). Interestingly, in the women, the values of all the indices trended toward being higher than did those of the men but the difference was significant only for LS (-16.08 ± 2.63 vs. -17.93 ± 2.77; P = 0.006) (Table 3). Time-to-peak (TTP) deformation indices were defined by calculating the time to reach peak systolic deformation for each segment as a percentage of cardiac cycle (Table 2). Except for a significant difference between TTP radial strain and apical rotation and age (r = 0 .27, P = 0.03 and r = 0 .28, P = 0.02 respectively) (Table 3) and sex (males, 303.6 ± 39.2 vs. females, 348.8 ± 80.7; P = 0.006) (Table 3), there were no significant differences between the TTP of the other deformation indices and either age or sex. A positive relationship was found between Ea and Ees and heart rate (r = 0.42, P < 0.001 and r = 0.23, P = 0.054) and LV end-diastolic volume (r = -0.41, P = 0.001 vs. r = -0.69, P < 0.001). A significant correlation was also found between Ees and VAC and EF (r = 0.37, P = 0.02 vs. r = -0.29, P = 0.018 respectively) (Figure 2). A significant correlation was found for both Ea and VAC with age (r = 0.30, P = 0.014 vs. r = 0.38, P = 0.001). A comparison of the mean values of Ea, Ees, and VAC showed a significantly higher value of Ees in the women than in the men (1.94 ± 0.48 vs. 2.4 ± 0.66; P = 0.002), but no sex difference was observed for the mean values of Ea (1.73 ± 0.63 vs. 1.98 ± 0.59; P = 0.104) and VAC (0.95 ± 0.45 vs. 0.89 ± 0.43; P = 0.589). Although our data showed significant relations between VAC and either Ea or Ees in the men and women, no relation was found between Ea and Ees in both sexes (r = 0.07 in men vs. r = 0.08 in women) (Tables 3). In addition, VAC was more strongly related to Ea than Ees (r = 0.708 vs. r = -0.537; P = 0.01) (Table 4). The analysis of the relationship between Ea and deformation indices revealed a significant negative association with CS (r = 0.64, P < 0.01) and 3DGS (r = -0.55, P < 0.01). There was also a significant relation between Ea and TTP LS, CS, apical rotation, and twist (Table 5, Figures 3 and 4). The analysis of correlation showed a significant positive relation between Ees and CS (r = 0.45, P < 0.01), torsion (r = 0.30, P = 0.01), and 3DGS (r = 0.38, P < 0.01) (Table 5, Figures 3 and 4). Additionally, Ees was significantly related only to the TTP values of CS (r = -0.23, P = 0.05). Our results showed significant relations between VAC and CS (r = 0.79, P < 0.01), torsion (r = -0.37, P < 0.01), and 3DGS (r = -0.64, P < 0.01). There was a significant relation between VAC and the TTP values of all myocardial deformation indices (all P < 0.01) except for torsion (r = 0.08, P = 0.58) (Table 5, Figures 3 and 4). Generally, all deformation indices were high in the women when compared with those of the men, although TTP deformation indices were not influenced by sex. In contrast to the men, the women demonstrated elevated values of Ea and substantially higher measures of Ees, but low values of VAC. However, no sex influence was demonstrated on the relations between Ea and Ees.4.1. Baseline Characteristics
![]()
4.2. Ventricular Deformation Indices
![]()
![]()
4.3. Time-to-Peak Systolic Deformation
4.4. Relations Between Arterial Elastance, Ventricular Elastance, and Ventricular-Arterial Coupling and Clinical and Two-Dimensional Echocardiographic Data

4.5. Relations Between Arterial Elastance, Ventricular Elastance, and Ventricular-Arterial Coupling and Age and Sex
4.6. Relations Between Arterial Elastance, Ventricular Elastance, and Ventricular-Arterial Coupling
![]()
4.7. Relations Between Arterial Elastance and Myocardial Deformation Indices
![]()

4.8. Relations Between Ventricular Elastance and Myocardial Deformation Indices
4.9. Relations Between Ventricular-Arterial Coupling and Myocardial Deformation Indices
4.10. Influence of Sex
5. Discussion
In our study of the relation between the parameters of myocardial mechanics and VAC, the following observations were made: Ees, but not Ea and VAC, was higher in the women than in the men. In addition, almost all deformation indices were higher in the women than in the men. VAC was related to both Ea and Ees in the men and women, but Ea and Ees were not related to each other in both sexes. Indeed, the association between VAC and Ea was stronger than was that with Ees. Finally, Ees and VAC were related to torsion and interestingly Ea, Ees, and VAC were all related to CS and 3DGS. However, we did not find an association between age and Ees, which has been observed in several other studies (18, 19). The primary reason for the lack of influence of age on Ees in our study was related to our study population, which was less than 50 years of age.
Although there are some well-known advantages for studying VAC and its components (Ea and Ees), these parameters also have some limitations (20).
The major disadvantage of Ees is that it cannot assess myocardial properties, which can be effectively assessed by deformation indices. VAC (Ea/Ees) does not characterize (and totally neglects) LV loading sequence; however, because of its major advantage (i.e., quantifying LV chamber contractility/stiffness and arterial load in the same units) (20), its relation to a particular deformation index may help determine a valuable indicator of cardiac performance amongst these parameters.
It has been shown that global strains correlate well with global LV function expressed as wall motion score and LVEF (21). In addition, speckle-tracking-derived CS has been reported to aid in the placement of pacing leads in the target areas of delayed contraction (22). In recent years, there has been increased interest in quantifying LV rotation (23), which is one of the most intriguing advancements in imaging techniques. The potential of LV rotation for the early detection of cardiac pathology (24), its ability to provide regional information, and its role as an indicator of active diastolic relaxation are deemed its significance (25). LV torsion and recoil are a result of the dynamic interaction between obliquely oriented epicardial and endocardial fibers. Rotation dominates in the epicardial layer and includes both systolic and diastolic indices of LV circumferential motion. It is well-established that LV rotation is sensitive to changes in both regional and global LV functions (26, 27). Therefore, assessment of LV rotation represents an important clinical tool for quantifying LV function insofar as it appears to be more sensitive to dysfunction than do many other traditional echocardiographic measures. Although cardiac magnetic resonance is thought to be a reliable standard for measuring LV rotation (28), the spatial restrictions of the magnet as well as the accessibility and affordability of this modality renders it less practical than is echocardiography.
Recently developed STE allows the assessment of torsion by echocardiography (29). The ability to quantify and track changes in LV rotation may provide further insight into the cardiac structure and function. For example, Hansen et al. (24) showed that despite no change in LVEF, reductions in torsion and torsion rate were found in their patients undergoing acute cardiac allograft rejection. Our results showed that Ees and VAC were related to torsion. This finding also strengthens the importance of torsion as a main mechanism of contraction and the effectiveness of cardiac mechanics and energetic sufficiency. The relations between Ea, Ees, and VAC and CS are also in favor of the crucial role of circumferential fibers in maintaining VAC within its narrow normal range. Therefore, it seems that torsion and CS should be considered surrogates for VAC, which is known as a well-distinguished marker of mechanical efficacy.
5.1. Study Limitations
Despite the statistical significance, the linear correlation coefficients were not very high. It means that we found real and important relationships among the study parameters, but they were not linear. Also it could have been due to the effects of other variables which we did not consider in our study. Accordingly, all the findings should be interpreted in light of these limitations.
Our data were derived from young healthy subjects and thus cannot be applied to all normal individuals. This study does not provide information on the relation between VAC and the parameters of myocardial mechanics in diseased states but provides a foundation for future studies in pathologic conditions.
5.2. Conclusions
Amongst all systolic myocardial deformation indices, VAC was related to CS and 3DGS as well as torsion. Since Ees was also related to CS and torsion, we suggest them as valuable indicators of cardiac performance.
Acknowledgments
This research has been presented as a poster presentation at 63rd American College of Cardiology Annual Scientific Session in Washington, DC. We thank all cardiac sonographers in the Cardiovascular Imaging and Hemodynamic Laboratory at Tufts Medical Center for their cooperation with image acquisition.
Footnotes
References
- 1. Shim CY. Arterial-cardiac interaction: the concept and implications. J Cardiovasc Ultrasound. 2011;19(2):62-6. [DOI] [PubMed]
- 2. Chantler PD, Lakatta EG, Najjar SS. Arterial-ventricular coupling: Mechanistic insights into cardiovascular performance at rest and during exercise. J Appl Physiol (1985). 2008;105(4):1342-51. [DOI] [PubMed]
- 3. Suga H. Time course of left ventricular pressure-volume relationship under various enddiastolic volume. Jpn Heart J. 1969;10(6):509-15. [PubMed]
- 4. Sunagawa K, Maughan WL, Burkhoff D, Sagawa K. Left ventricular interaction with arterial load studied in isolated canine ventricle. Am J Physiol. 1983;245(5 Pt 1):H773-80. [PubMed]
- 5. Kelly RP, Ting CT, Yang TM, Liu CP, Maughan WL, Chang MS, et al. Effective arterial elastance as index of arterial vascular load in humans. Circulation. 1992;86(2):513-21. [PubMed]
- 6. Chantler PD, Lakatta EG. Arterial-ventricular coupling with aging and disease. Front Physiol. 2012;3:90. [DOI] [PubMed]
- 7. Starling MR. Left ventricular-arterial coupling relations in the normal human heart. Am Herat J. 1993;125(6):1659-66. [DOI]
- 8. Najjar SS, Schulman SP, Gerstenblith G, Fleg JL, Kass DA, O'Connor F, et al. Age and gender affect ventricular-vascular coupling during aerobic exercise. J Am Coll Cardiol. 2004;44(3):611-7. [DOI] [PubMed]
- 9. Brown J, Jenkins C, Marwick TH. Use of myocardial strain to assess global left ventricular function: A comparison with cardiac magnetic resonance and 3-dimensional echocardiography. Am Heart J. 2009;157(1):102 e1-5. [DOI] [PubMed]
- 10. Edvardsen T, Helle-Valle T, Smiseth OA. Systolic dysfunction in heart failure with normal ejection fraction: Speckle-tracking echocardiography. Prog Cardiovasc Dis. 2006;49(3):207-14. [DOI] [PubMed]
- 11. Nagueh SF, McFalls J, Meyer D, Hill R, Zoghbi WA, Tam JW, et al. Tissue doppler imaging predicts the development of hypertrophic cardiomyopathy in subjects with subclinical disease. Circulation. 2003;108(4):395-8.
- 12. Nakai H, Takeuchi M, Nishikage T, Lang RM, Otsuji Y. Subclinical left ventricular dysfunction in asymptomatic diabetic patients assessed by two-dimensional speckle tracking echocardiography: Correlation with diabetic duration. Eur J Echocardiogr. 2009;10(8):926-32. [DOI] [PubMed]
- 13. Hansen DE, Daughters G, Alderman EL, Ingels NB, Miller DC. Torsional deformation of the left ventricular midwall in human hearts with intramyocardial markers: Regional heterogeneity and sensitivity to the inotropic effects of abrupt rate changes. Circ Res. 1988;62(5):941-52. [PubMed]
- 14. Notomi Y, Martin-Miklovic MG, Oryszak SJ, Shiota T, Deserranno D, Popovic ZB, et al. Enhanced ventricular untwisting during exercise: a mechanistic manifestation of elastic recoil described by Doppler tissue imaging. Circulation. 2006;113(21):2524-33. [DOI] [PubMed]
- 15. Park SJ, Nishimura RA, Borlaug BA, Sorajja P, Oh JK. The effect of loading alterations on left ventricular torsion: A simultaneous catheterization and two-dimensional speckle tracking echocardiographic study. Eur J Echocardiogr. 2010;11(9):770-7. [DOI]
- 16. Meunier J. Tissue motion assessment from 3D echographic speckle tracking. Phys Med Biol. 1998;43(5):1241-54. [PubMed]
- 17. Chen X, Xie H, Erkamp R, Kim K, Jia C, Rubin JM, et al. 3-D correlation-based speckle tracking. Ultrason Imaging. 2005;27(1):21-36. [PubMed]
- 18. McEniery CM, Wilkinson IB, Avolio AP. Age, hypertension and arterial function. Clin Exp Pharmacol Physiol. 2007;34(7):665-71. [DOI] [PubMed]
- 19. Yin JH, Song ZY, Shan PF, Xu J, Ye ZM, Xu XH, et al. Age- and gender-specific prevalence of carotid atherosclerosis and its association with metabolic syndrome in Hangzhou, China. Clin Endocrinol (Oxf). 2012;76(6):802-9. [DOI] [PubMed]
- 20. Chirinos JA. Ventricular-arterial coupling: Invasive and non-invasive assessment. Artery Res. 2013;7(1) [DOI] [PubMed]
- 21. Carasso S, Agmon Y, Roguin A, Keidar Z, Israel O, Hammerman H, et al. Left ventricular function and functional recovery early and late after myocardial infarction: a prospective pilot study comparing two-dimensional strain, conventional echocardiography, and radionuclide myocardial perfusion imaging. J Am Soc Echocardiogr. 2013;26(11):1235-44. [DOI] [PubMed]
- 22. Suffoletto MS, Dohi K, Cannesson M, Saba S, Gorcsan J. Novel speckle-tracking radial strain from routine black-and-white echocardiographic images to quantify dyssynchrony and predict response to cardiac resynchronization therapy. Circulation. 2006;113(7):960-8. [DOI] [PubMed]
- 23. Esch BT, Warburton DE. Left ventricular torsion and recoil: implications for exercise performance and cardiovascular disease. J Appl Physiol (1985). 2009;106(2):362-9. [DOI] [PubMed]
- 24. Hansen DE, Daughters G, Alderman EL, Stinson EB, Baldwin JC, Miller DC. Effect of acute human cardiac allograft rejection on left ventricular systolic torsion and diastolic recoil measured by intramyocardial markers. Circulation. 1987;76(5):998-1008. [PubMed]
- 25. Burns AT, McDonald IG, Thomas JD, Macisaac A, Prior D. Doin' the twist: new tools for an old concept of myocardial function. Heart. 2008;94(8):978-83. [DOI] [PubMed]
- 26. Hansen DE, Daughters G, Alderman EL, Ingels NB, Stinson EB, Miller DC. Effect of volume loading, pressure loading, and inotropic stimulation on left ventricular torsion in humans. Circulation. 1991;83(4):1315-26. [PubMed]
- 27. Buchalter MB, Rademakers FE, Weiss JL, Rogers WJ, Weisfeldt ML, Shapiro EP. Rotational deformation of the canine left ventricle measured by magnetic resonance tagging: effects of catecholamines, ischaemia, and pacing. Cardiovasc Res. 1994;28(5):629-35. [PubMed]
- 28. Notomi Y, Setser RM, Shiota T, Martin-Miklovic MG, Weaver JA, Popovic ZB, et al. Assessment of left ventricular torsional deformation by Doppler tissue imaging: validation study with tagged magnetic resonance imaging. Circulation. 2005;111(9):1141-7. [DOI] [PubMed]
- 29. Teske AJ, De Boeck BW, Melman PG, Sieswerda GT, Doevendans PA, Cramer MJ. Echocardiographic quantification of myocardial function using tissue deformation imaging, a guide to image acquisition and analysis using tissue Doppler and speckle tracking. Cardiovasc Ultrasound. 2007;5:27. [DOI] [PubMed]
")


